Introduction
Every Operations Order (OPORD) has a weather annex. Every pre-flight checklist has a weather block. Every range control officer checks the forecast before going hot. And almost none of that data is useful past the first thirty minutes.
The problem is not that operators ignore the environment - they don't. The problem is that the tools we've given them treat weather, fire conditions, terrain, and other environmental factors as isolated checkboxes instead of what they are: continuous modifiers on every sensor, every datalink, every route, and every decision in the operational picture. You check a METAR, you pull a TAF, you glance at a NOTAM, maybe you check FIRMS if someone reminds you, and then you go fly. If conditions change mid-mission - and they will - you find out the hard way or you find out late.
We built the Weather and Environmental Intelligence Service (WEIS) because we got tired of watching this happen. WEIS is not a simple weather widget or "yet another ATAK plugin". It is an assessed intelligence layer that fuses atmospheric, fire, terrain, and space weather data into the same operational picture where your tracks, sensors, and decision tools already live. It doesn't sit in a separate tab you forget to check. It modifies the confidence of your tracks, the feasibility of your routes, and the reliability of your sensors - automatically, continuously, and in context.
Our intent is to give your teams a vote even if Mother Nature always gets her own, and a veto. It's not enough to forecast and then deal with it, or you'll be like me sitting in a muddy, water-filled trench with a garbage bag around radios and BB-2590s. Misery mitigation, flight planning, fighting fires, establishing comms, anything that is at the whims of Mother Nature will be within your reach to act against accordingly.
In this blog, we'll walk through what WEIS does, why fire intelligence deserves its own intelligence feeds, how all this feeds into UAS operational planning, and where we're heading next. If you want the technical deep-dive on how these modules compose together, check out our All-Domain Weather & Environmental Intelligence recipe.
Fire Intelligence: The Overlooked Domain Modifier
We're leading with fire because it is the single most operationally impactful environmental factor that almost no one integrates into their common operating picture in real-time. Weather gets a checkbox, terrain gets a map layer, and fire gets...a phone call to the local dispatch, maybe, if someone thinks to make it.
(It goes without saying that our customers fighting fires in the west coast, or parts of Fire & EMS, obviously are much better disciplined and resourced for this task)
Why Fire Matters Beyond Firefighting
Fire intelligence is not just for wildfire response teams. If you're operating UAS anywhere in the western United States between May and October, fire conditions are an operational constraint whether you acknowledge them or not. Besides that, smoke and fire columns will degrade your EO/IR sensors and can close down your airspace - maybe with a TFR with a few hours of notice. Wind shifts can push fire lines across your planned route corridor faster than you can re-plan.
For military ranges, and I have seen this firsthand, fire is a constant background concern. Live-fire exercises create fire risk as tracer rounds on dry fuel loads create fire risk, to say nothing of using high explosives or performing a Code H BIP. A large frame UAS with a LiPo battery that has a bad day on landing creates fire risk. The question is not whether fire will be a factor in your operations. The question is whether you'll know about it before it becomes a problem.
If bad weather whips up while there is a fire, now you're looking at a spread that requires data on moisture, terrain, live weather, fuel load, and a veritable physics team on standby to try to figure out where it is going. Outside of the organizations directly tasked with dealing with this threat, everyone else is woefully unprepared.
What WEIS Does with Fire Data
NASA FIRMS (Fire Information for Resource Management System) aggregates active fire detections from the MODIS sensors aboard Terra, Aqua, and the VIIRS sensors aboard Suomi NPP, NOAA-20, and NOAA-21. These are thermal detections of actively burning fires, updated multiple times per day, with fire radiative power (FRP) measurements that tell you how intense the fire is, not just that it exists.
WEIS ingests FIRMS hotspots as a first-class data feed, not a static map overlay. Every hotspot carries confidence scoring, satellite source attribution, detection timestamp, and FRP. These flow into the same spatial pipeline as your tracks and sensor feeds, which means they show up on your COP alongside everything else, they trigger proximity alerts through our Policy Engine, and they feed into route assessments for UAS mission planning.
If you want to figure out where these satellites are and when they're overhead, our Space Situational Awareness and Space Domain Awareness module lets you pull them from the catalog and track them in real time. You can set up a polygon on the map to alert you when they enter a pass window, re-pull FIRMS data on the next overpass, or determine whether you'll have a coverage window in the hours ahead. For a deeper dive on the space domain and how it impacts your operations, check out our blog on How the Space Domain Impacts Your Operations.
That said, hotspots alone are not fire intelligence. Fire behavior is driven by weather - specifically wind speed, wind direction, humidity, and temperature. A fire with 5 MW of radiative power in 80% humidity with 3-knot winds is a different animal than the same detection at 15% humidity with 25-knot gusts. WEIS couples FIRMS detections with the latest available NWS weather observations to provide context that a hotspot pin on a map cannot: is this fire likely to spread toward your operating area, and how fast?
We also correlate FIRMS detections against active wildfire perimeters from the National Interagency Fire Center, pulled from their WFIGS distribution service. Sometimes NIFC will have a perimeter mapped before FIRMS registers a new hotspot at the fire's edge; sometimes FIRMS will catch a flare-up hours before the perimeter is redrawn. Now you have both correlated and on the same map.
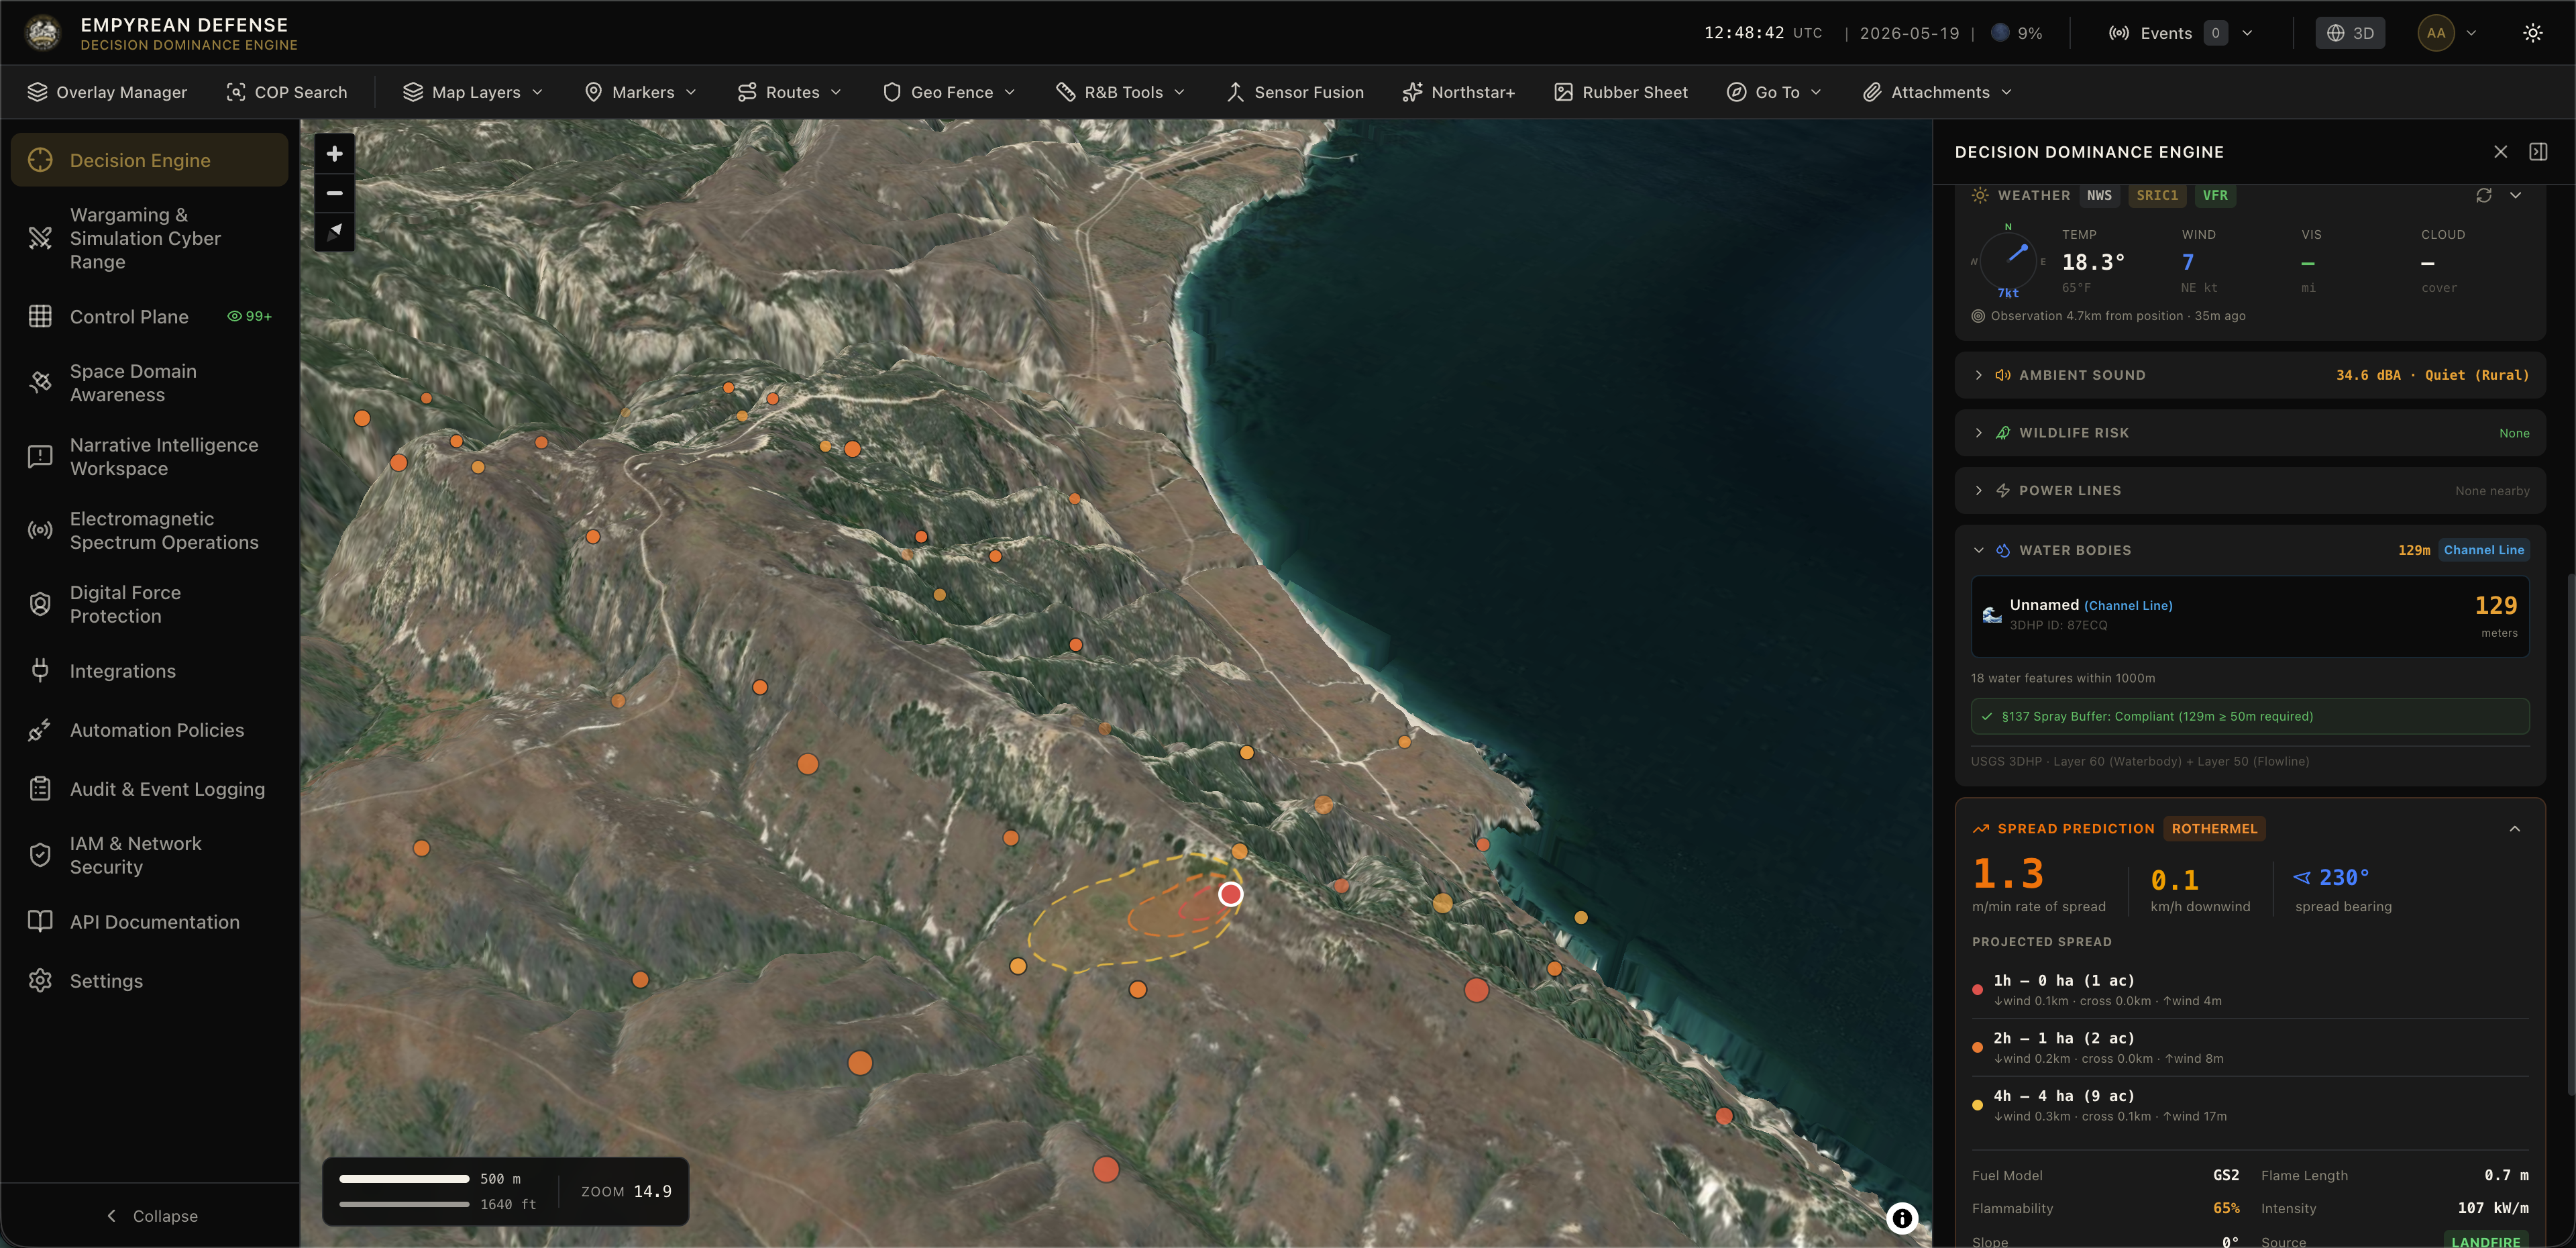
Under the covers, we pull all 40 burnable fuel models from the Scott and Burgan FBFM40 system via LANDFIRE, with ESA WorldCover providing a global flammability fallback where LANDFIRE coverage ends. Fuel loads, slope, and aspect feed a Rothermel spread model that projects fire behavior - rate of spread, flame length, fireline intensity - as ellipse polygons at one, two, and four-hour intervals on the map, along with estimated burned area and population at risk via LandScan data. Separately, the Canadian Forest Fire Weather Index (FWI) System provides fire weather danger ratings that feed into our UAS route risk scoring, so your pre-flight assessment accounts for what the fire weather regime means for your specific mission corridor, not just whether there's a hotspot nearby.
Spread projections also account for terrain and water. SRTM elevation data feeds slope and aspect into the spread model because fire accelerates uphill - a factor that flat-map fire tools routinely ignore. Our projected spread ellipses are clipped against water body boundaries because rivers and lakes act as natural firebreaks, unless the water feature is narrow enough that spotting can jump it, in which case we don't clip it. The result is a spread forecast that looks like what fire does on real terrain, not a perfect circle expanding from a point on a flat plane.
The Thermal UAS Play
This one is forward-looking but worth planting the flag on: FLIR-equipped UAS as ad-hoc fire intelligence sensors. A drone with a thermal camera that's already in the air for ISR or survey work can detect fire starts before they become hotspots visible to satellites. WEIS is architected to accept these detections into the same fire intelligence pipeline as FIRMS data - different sources, same ontology, same alerting, same route impact assessment.
As far as thermals and drone impact go, we also have data that leverages the same Fire Intelligence methodologies to understand impact to drone flights and alert to proximity of fires, especially if you're in the path of a fire after our propagation calculations. Losing your eyes in the sky would be devastating to most public safety organizations who may lack the funding to easily replace the air frames. Understanding the impacts of smoke on EO/IR sensors, understanding safe flight corridors, and having the future-looking kit is just as important as understanding FAA Part 108 BVLOS (still in Final Rule as of the time of this publishing) operations regulations and inclement weather.
Weather as Assessed Intelligence
Now for the part everyone thinks they already have covered. You don't.
The METAR/TAF Problem
A METAR tells you what the weather was like at a specific airport at a specific time. A TAF tells you what the weather is forecast to be at that same airport for the next 24-30 hours. Both are point observations anchored to fixed locations - almost always airports. If your operation is not at an airport, you're interpolating. If your route corridor spans 30 nautical miles, you're guessing what conditions look like at the far end based on what they look like at the nearest reporting station.
This is the state of the art for most operational weather planning. It has been since before GPS existed. Not to beat it up too much, we do use METAR via the Aviation Weather Center (AWC) if there is an airport within range, especially for our UAS mission planning for FAA Part 108 BVLOS flights near an airport. It's only a small piece of a larger weather pie.
We did want to go beyond hooking up a Web Map Server (WMS) or Tile Map Service (TMS) overlay though, which is how teams who operate in ATAK are mostly forced to consume the data. Don't get me wrong, we know of at least a dozen companies based on some quick Google searches that are providing weather intelligence from IoT sensors and other packages into ATAK, but these are largely paid-for plugins that most public safety teams may not have access to. Instead, folks are forced into a NEXRAD or some other NOAA TMS overlay. That's fine; we support the same too. It's a good "Mk. 1 Eyeball" assessment of weather moving towards you (not to mention specialized datasets you can infer from NEXRAD), but we wanted to do better.
What WEIS Actually Provides
WEIS pulls from multiple weather observation networks and fuses them into an environmental picture scoped to your operating area, updated automatically, and presented alongside your tracks and sensor feeds. This is the same sensor fusion philosophy we apply across the entire platform - multiple sources, weighted confidence, unified output.
NWS Observations from the National Weather Service API provide station-based weather data across the US and territories. Temperature, wind speed and direction, humidity, visibility, cloud ceiling, pressure, and precipitation. WEIS auto-refreshes observations hourly for every enabled Area of Interest and pushes updates to connected clients over WebSocket. This is automated to prevent stale data, but it can be repulled on demand as well.
AWC METAR from the Aviation Weather Center provides international airport weather observations on a 15-minute polling cycle. If you're operating near an airfield or planning routes that transit controlled airspace, METAR data is ground truth for flight-rule determination. WEIS ingests and decodes these automatically as structured data for backend processes as well as human-readable text in the frontend.
APRS Weather Stations are another unique way to get localized data into the Decision Dominance Engine. Amateur radio operators run personal weather stations that report through the APRS-IS network, and many of them are in locations where NWS and METAR coverage is sparse - rural areas, remote terrain, private land. WEIS aggregates these as hyper-local ground truth observations. They won't replace a certified METAR for regulatory purposes, but for operational awareness in areas between airports, they fill gaps that nothing else does.
For spatial resolution, WEIS performs nearest-station lookup within your AOI with source priority weighting - METAR observations carry higher confidence than NWS point forecasts, which carry higher confidence than APRS reports - and distance-based confidence scoring so you know how representative the observation is for your actual position. If the nearest station is 45 km away, the system tells you that, rather than presenting the data as if it were measured at your feet.
Visual overlays for NEXRAD radar returns, NDFD forecast imagery, GOES satellite, and MRMS precipitation are available as map layers for broader situational awareness. These render standard WMS tiles on your COP - useful for seeing the big picture of what's moving toward your operating area, even when your nearest observation station hasn't registered the change yet.
All of this is scoped to your Areas of Interest (AOIs). You define your AOI on the map via Map Features such as Markers, Polygons, or otherwise. WEIS pulls weather for that AOI, and conditions are cached and updated on cycle. We also support pulling the weather data near live tracks on the map as well, useful for getting a quick check during a UAS flight, for firefighting or smokejumper aircraft, or just on the ground for positions reported via our Digital Force Protection electromagnetic domain live tracks.
On the weather side specifically, WEIS today is built on station-based observations - real measurements from real instruments at real locations. The next evolution is gridded model ingest, such as GFS global atmospheric data at 0.25-degree resolution and NDFD surface forecasts as query-ready data. That shift lets us answer weather queries at any arbitrary point in your AOI - over open ocean, over wilderness, over denied territory where there are no reporting stations - rather than interpolating from the nearest one.
For maritime operations, that means ingesting NOAA WaveWatch III wave model output and NDBC buoy observations for real-time sea state: wave height, period, swell direction, and Beaufort classification as assessed data in the fusion pipeline, not just physics models in our simulation engine (which we do very faithfully along with subsurface weather). If you're recovering a UAS to a vessel or planning maritime ISR, sea state determines whether you can land, whether your radar has clutter problems, and whether your crew can safely operate on deck. We intend to have that answer for you from live data, not just from a lookup table.
Weather as a Fusion Input
Weather data doesn't just render on the map; it also flows into the fusion engine as a confidence modifier. There are many occasions where the weather (and fires) will degrade the performance of your sensors, and sensor fusion systems that only account for kinematics and greedy associations can produce low confidence tracks as a result.
Degraded visibility reduces the assessed confidence of EO/IR sensor tracks; smoke columns obscure your visible lens while fire can degrade lower-end bolometers. High sea state increases clutter in maritime radar returns, which the fusion engine accounts for when scoring track quality. High winds affect UAS endurance calculations and C2 link stability. Atmospheric conditions affect RF propagation for datalinks and sensor downlinks. If you want a deeper dive on why the electromagnetic domain matters to everyone, our blog on EMSO being everyone's problem covers the doctrine and practical implications in detail.
None of this requires the operator to manually cross-reference weather against their track picture. The fusion engine does it automatically because WEIS provides environmental state as structured data into our patent pending fusion engine which is already taking kinematic, trust, and identity provenance data into account. For more on how our fusion engine handles multi-sensor correlation, see our Sensor Fusion FAQ.
UAS Operations: Where It All Converges
If fire intelligence and weather-as-assessed-intelligence are the individual capabilities, UAS operational planning is where they prove they belong together. While understanding the regulations and changing Rules in UAS operations CONUS is important, it's far more important to have the best datasets available to help with planning and in-flight risk management for your entire fleet, across any mission you use UAS for.
The Part 108 BVLOS Problem
The FAA's Part 108 rules for Beyond Visual Line-of-Sight UAS operations are arriving, and with them comes a set of compliance requirements that demand environmental awareness that most operators don't have tooling for. Section 108.185 categorizes routes by population density - which means you need to know not just where people are, but how many people are under each leg of your route, in near-real-time.
Population density is the headline compliance metric, but Part 108 doesn't exist in a vacuum. Your route also needs clear terrain (obstacle avoidance), maintain C2 link coverage (RF propagation), avoid active fire perimeters and TFRs, and operate within weather minimums for your aircraft category. Today, each of these is a separate check against a separate data source, performed before the flight and assumed to hold for the duration.
WEIS, combined with our Air Domain Intelligence (ADI) module, makes this a single assessment. In total we have a 12-domain composite scoring mechanism across these various inputs, some of them mandated by FAA and some of them are just common sense and additive for mission planning:
For FAA Required Situational Awareness, we include the following datasets as Map Data Feeds within our product, where we provide the underlying data for fusion and the geospatial products can be visualized on our Common Operating Picture (COP).
- UAS Facility Maps (UASFM): FAA-published altitude authorizations by grid cell, the data that determines your LAANC authorization ceiling with auto-approval under §107.41 and §108.185.
- All airspace categorization from National Airspace System Resources (NASR) (e.g., SUA, B/C/D): NASR data includes airspace categorizations for all airspace categories, Special Use Airspace (SUA), and more
- TFRs: Temporary Flight Restrictions (TFRs) from the FAA API gives us data on temporality and location of TFRs
- NOTAMs: Notices to Air Missions, the bane of every pilot's pre-flight. Ingested, parsed, and rendered spatially so you can see which NOTAMs actually affect your route rather than scrolling through a text wall of irrelevant advisories 400 miles away.
- Digital Obstacle File (DOF): Includes data on towers, antennas, buildings, and other vertical obstructions. Critical for BVLOS route clearance where you cannot visually see and avoid.
- Airport Surface Areas
- GPS/PNT degradation checks
It goes further than that; these are what you're meant to check, at least partially for current Part 91 and Part 107 waivers. When FAA Part 108 and 146 come online for BVLOS, there are many more facets of a proposed operation that need to be assessed to maximize risk mitigation, mission success, and protection of the environment and local populations (humans and wildlife alike). That leads back into the core thesis of the platform, providing data sources that can be intelligently fused and made useful for multiple different operating domains, and WEIS provides the backbone for enhanced risk management scoring. This is the same JADC2 philosophy of connecting sensors and decision-makers across domains - applied to the regulatory and environmental space.
The additional criteria are aligned against current FAA regulations in Part 91, Part 107, Part 135, and Part 137 as well as Part 146 which is proposed alongside Part 108 NPRM. Additionally, these are aligned to best practices and requirements from ASTM F3623-23 Surveillance Supplementary Data Service Providers, RTCA DO-362A / DO-377B, and the Joint Authorities for Rulemaking of Unmanned Systems (JARUS) SORA 2.5, and ASTM F3673-23 Weather SDSP Performance criteria.
Of course, we don't support every single bit of those cited works, but they're the industry basis we rely on to ensure our lingua franca of UAS Traffic Management (UTM) and UAS safety is up to snuff. Our scoring dimensions, which are largely powered by WEIS, are as follows:
- Population Density: Using the ORNL LandScan US 2021 Day and Night (90m resolution U.S. population grid), each leg samples a 200m buffer corridor and classifies density against §108.185 thresholds. In the event there is a gap (such as remote locations and OCONUS operations), we fall back to the ORNL LandScan Global 2024 dataset, which uses 1km global population grids, and is less precise.
- C2 Link Budget Propagation: ITU-R P.525 free-space path loss at the aircraft profile's C2 frequency (typically 2.4/5.8 GHz), plus SRTM terrain profile extraction with ITU-R P.526-15 knife-edge diffraction for obstructed paths, and ITU-R P.838 rain attenuation from live METAR precipitation data. Samples every 500m along each leg from the Ground Control Station (GCS) to the UAS position. Uses per-platform Tx power from the aircraft profile database. This leverages the same RF propagation modeling we use for EMSO spectrum planning.
- Weather Conditions: NOAA METAR/TAF from nearest ASOS/AWOS stations (typically <15nm). Factors scored against aircraft-specific operating envelopes from the profile. Where available, WEIS can sample hyper-localized weather data from APRS, but as they are not certified weather stations in most cases, NOAA and NWS datasets are authoritative.
- Crash-Fire Consequence: USGS LANDFIRE Fuel Bed Model (40-class, 30m) combined with battery thermal runaway probability model. If your pre-flight checklist doesn't account for what happens to a fully charged LiPo in dry brush with 25-knot winds, your pre-flight checklist is incomplete.
- Fire Proximity: NIFC WFIGS active perimeters (hourly ArcGIS REST polling) + NASA FIRMS satellite hotspots with Rothermel (1972) spread ellipse predictions. Checks both static perimeter distance and dynamic spread path intersection. ESA WorldCover and Terrain data also feed the spread, where WorldCover flammability is used in the event there isn't LANDFIRE fuel data for the locale.
- Power Line Proximity: HIFLD Transmission Lines dataset (DOE/DHS). Measures minimum lateral clearance from route corridor centerline to nearest HV line (≥69kV). This provides 3D spatial awareness in the horizontal plane in addition to the DOF dataset we pull from the FAA.
- Terrain Suitability: We take our native support for Digital Elevation Mapping (DEM) data (e.g., 1 arc second SRTM, 33cm bathymetry) alongside ESA WorldCover 10m data to measure distance from natural barriers as well as landing & recovery suitability given the terrain type from WorldCover.
- Water Body Proximity: Uses the USGS 3D Hydrography data to determine how long the over-water duration of the flight will be. For flights assessed under Part 137 for agricultural spraying, this is an additional scoring dimension for contamination.
- Ambient Noise Scoring: Ambient sound levels along the route to assess UAS audibility and community noise impact using the NPS Geospatial Sound Model (L50 existing conditions, 270m resolution). Lower ambient background noise means the UAS more audible, which has a higher community and wildlife impact.
- Traffic Density: This includes using our analytics database of all ingested live UAS and aircraft tracks gathered by ADS-B, UAT, AFF, ODID, and first-party UAS SDKs and receivers to determine the historical data of flights in the area. This is much more operationally relevant; ostensibly users will also ingest those feeds. This is an important airspace deconfliction and monitoring capability, while we do not support Traffic Collision Avoidance System (TCAS) functionality today. That is a potential research area for us as well.
- Wildlife Strike Risk: Using the FAA's own data since 1996, our analytics service determines if there is any historical data along the flight corridor for risk of a bird strike or other wildlife encounter. This already includes data on land animals, and in the future when we support UGV missions, that data is already useful.
- Spray Drift: EPA spray drift model (AgDRIFT Tier 1) combined with wind speed/direction from nearest ASOS and buffer distances to sensitive receptors. This is only shown if you pick FAA Part 137 as part of your scoring criteria.
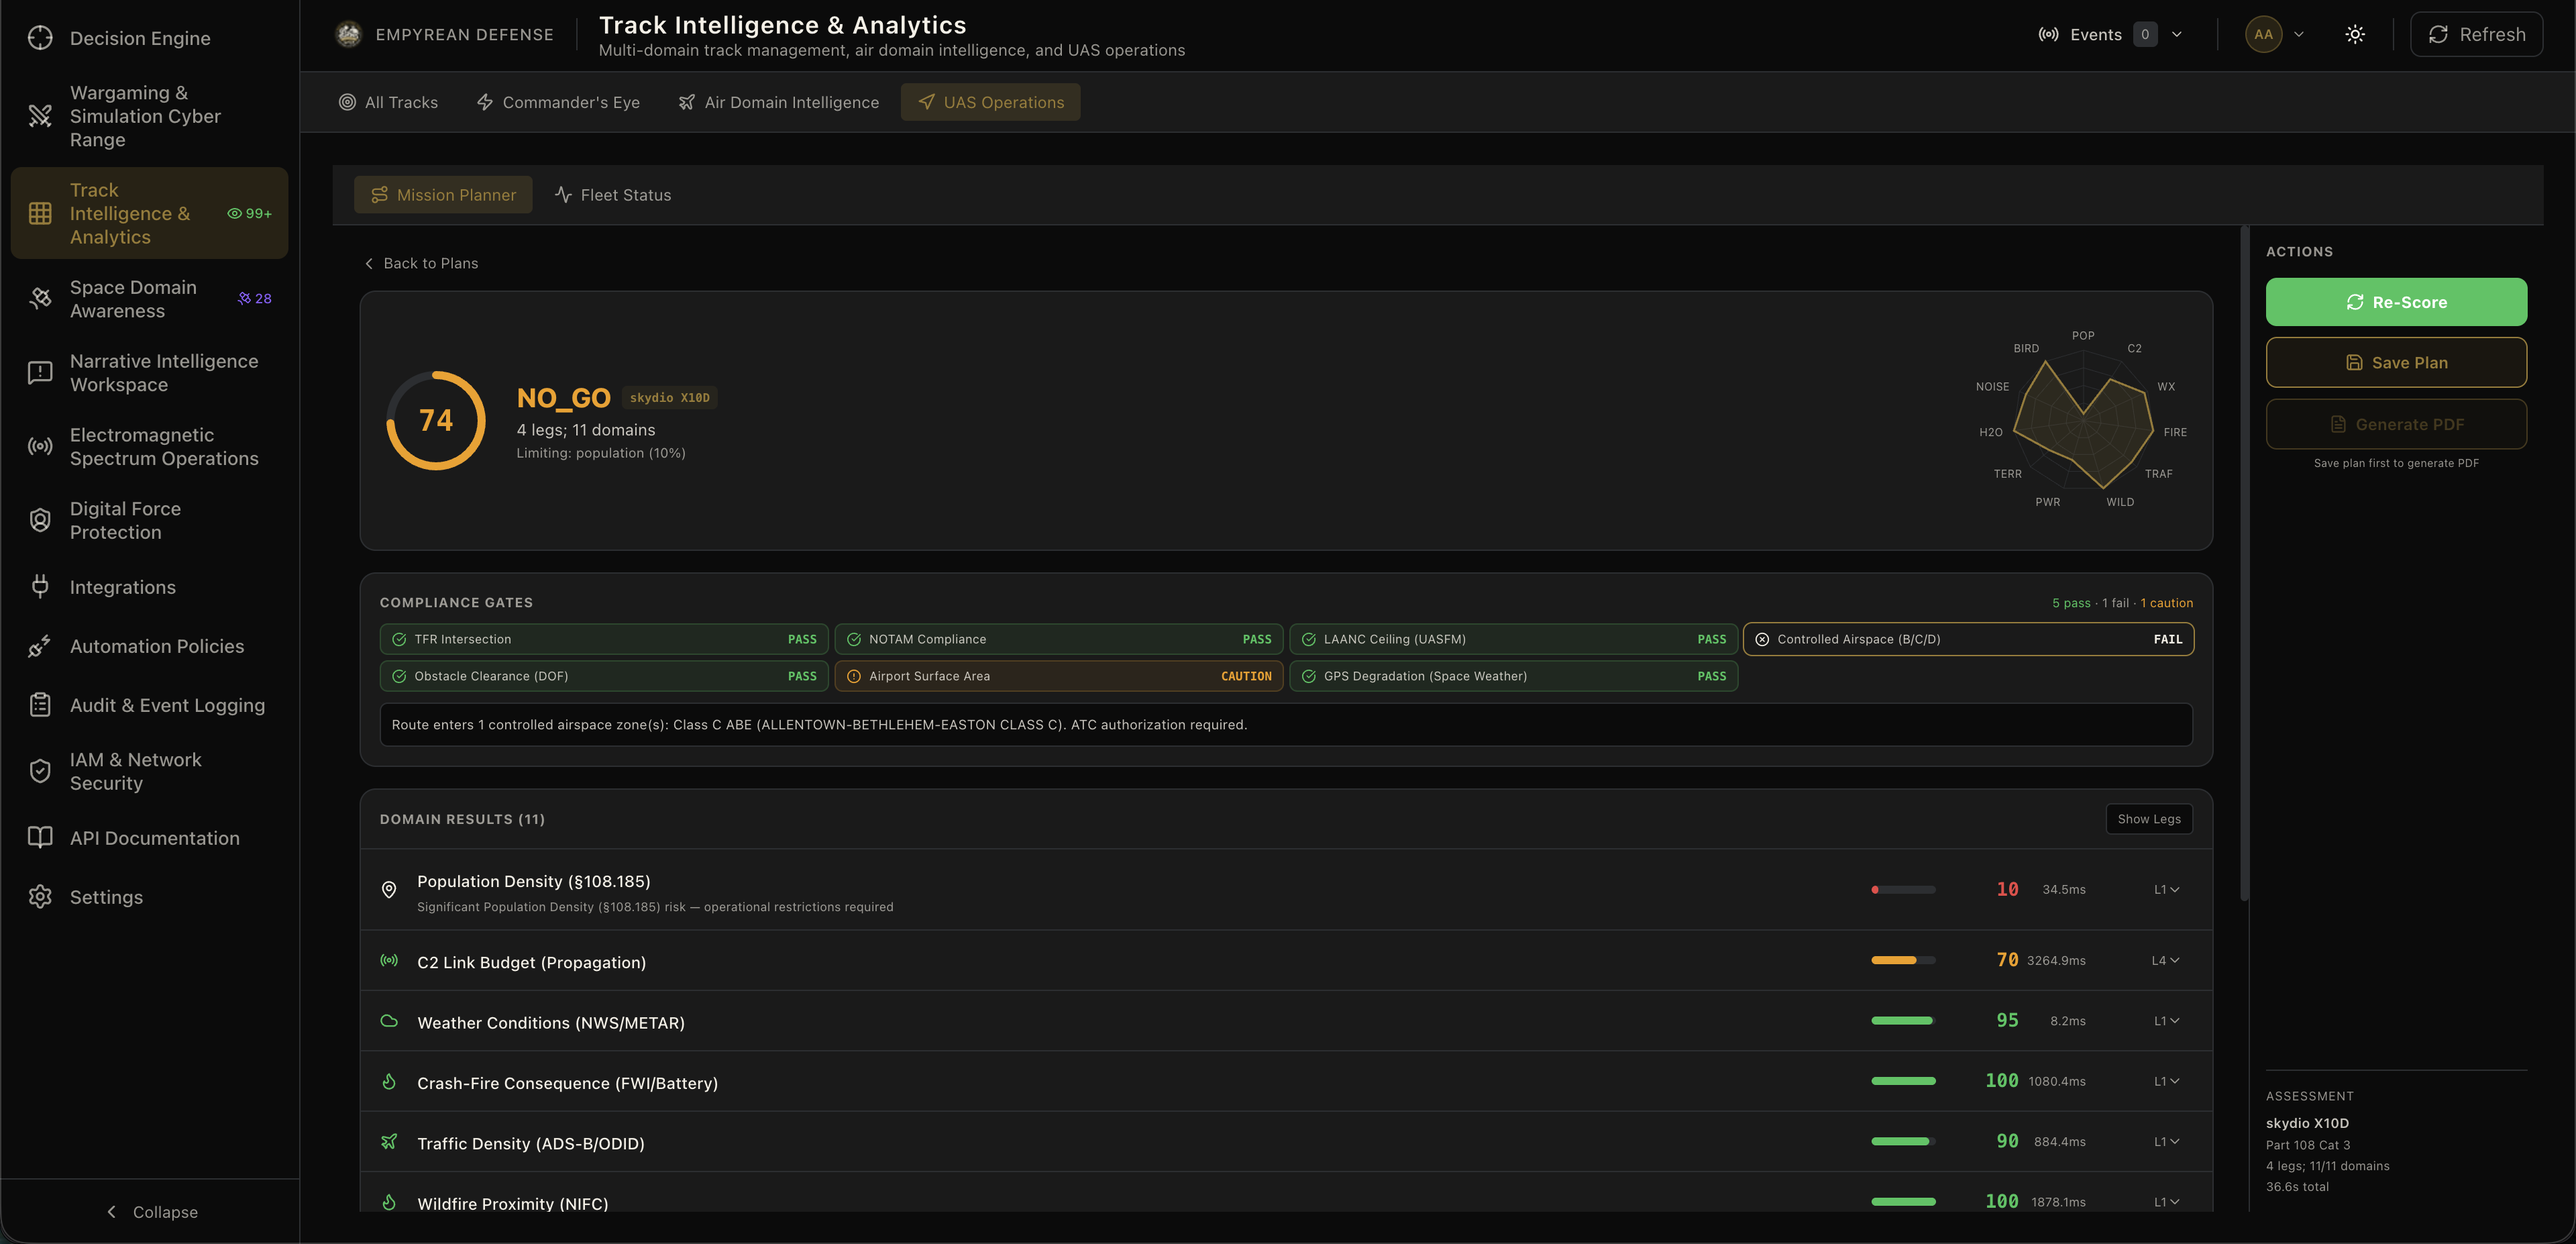
As you can probably tell, some of these facets are outside of scope for WEIS but build on existing track intelligence and analytical services in the Empyrean Defense platform. When we built this platform, the idea was always to build dedicated workspaces for specific operator personas, but that the data fusion engine can transparently use the products across other workspaces and modules. All in, WEIS is a massive contributor for UAS BVLOS risk management and proves our own thesis to us, and we are only getting started.
Cross-Domain Environmental Effects
If you read our Space blog ("How the Space Domain Impacts Your Operations"), you already know we think of cross-domain effects. Weather and environment are no different - they don't stay in their lane. This is also why we built our platform around the JADC2 philosophy of connecting all domains into a unified decision architecture.
Space Weather and Your GPS
Space weather is not an abstraction. A G2 geomagnetic storm degrades GPS accuracy, induces errors in satellite-based augmentation systems, and can cause position jumps that make your UAS autopilot very unhappy. WEIS ingests NOAA Space Weather Prediction Center data - Kp index, solar wind, Dst, G/S/R scales - and presents it alongside your terrestrial weather picture.
If you're planning a precision agricultural survey that depends on RTK GPS accuracy, and the Kp index is forecast to hit 6, that is operationally relevant information. If you're running a BVLOS mission that depends on GPS for navigation and your link budget for SATCOM C2 is already marginal, ionospheric scintillation from a solar particle event can break your mission. WEIS surfaces this so you know before you launch, not after you lose lock. You can consume this data via our Space Domain Awareness capability, and it is also automatically adjudicated as part of any UAS Operations risk assessment. For more on how space weather impacts operations, see our SSA FAQ.
Maritime Sea State
For maritime UAS operations - shipboard launch and recovery, coastal ISR, offshore infrastructure inspection - sea state is the environment modifier that controls everything. WEIS will provide WW3 wave model data and NDBC buoy observations as assessed maritime environmental intelligence, not just a wave height number but a Beaufort Sea state classification that maps directly to operational go/no-go criteria.
As we continue to expand our partnerships across the industry, this will coalesce into our upcoming Maritime Intelligence and Threat Finance & Entity Resolution capabilities. This will be a large cross-cutting capability set that serves sanctions, Financial Intelligence (FININT), counter-piracy, port security, littoral defense, and other maritime and surface warfare use cases. We will continue to plumb across government and open-source datasets to provide "always on" WEIS-relevant datasets for the surface and subsurface environments including subsurface terrain data we're excited to get started on.
What's Coming Next
WEIS shipped as our first environmental intelligence service, but the roadmap extends well beyond current conditions and fire hotspots.
Ionospheric intelligence and SATCOM propagation modeling will thread ionospheric conditions through RF link budget calculations, enabling automated assessment of whether SATCOM or HF links are degraded due to ionospheric disturbance versus actual interference - a question that EMSO operators currently answer by guessing. This will augment our multifaceted RF and cellular propagation and coverage modules, and work with Space Domain Awareness pass windows and revisitation monitoring to close the space-to-ground RF continuum.
MASINT-adjacent capabilities including NOAA HYSPLIT atmospheric dispersion modeling for CBRN plume prediction, seismic event ingestion from USGS, and atmospheric composition data from Sentinel-5P. HYSPLIT coupled with live NWS wind data gives you a CBRN plume overlay on your COP that updates with actual conditions, not a static dispersion estimate from six hours ago. We'll continue to feed these data sets into our Part 137 spray risk models for automated agricultural operations, as well as firefighting use cases where rotary and fixed wing assets are used to spread retardants.
Gridded forecasts for predictive planning from GFS/HRRR models - wind at altitude for UAS route planning, not just surface observations. This shifts WEIS from telling you what conditions are now to telling you what they'll be at mission time. We are also looking for space-based weather partners in this area to provide hyper-localized nowcasting from the air and space that can provide even better telemetry than integrations with Kestrel weather stations or weather-capable ballistic calculators we also plan to integrate.
Closing Thoughts
The environment has always had a vote in your operations. The only question is whether you knew about the vote before it was cast or after the damage was done.
WEIS exists because we watched too many teams treat weather as a pre-brief checkbox and fire as someone else's problem - until it wasn't. The fusion engine doesn't care whether the data comes from an NWS station, a FIRMS satellite pass, an APRS ham radio operator in the middle of nowhere, or a Kestrel on someone's belt. It cares that the data is current, that it is spatially relevant to your operation, and that it modifies your operational picture automatically, so you're not alt-tabbing between six browser windows while your UAS is in the air.
We built twelve scoring dimensions into the UAS route assessment not because twelve is a nice number but because each one represents a real scenario that impacts a UAS mission, BVLOS or not. Each dimension exists because someone, somewhere, learned the hard way.
If any of what we covered in this blog is relevant to your operations - whether you're a public safety UAS program trying to operationalize BVLOS, a military planner who needs environmental intelligence fused into the OPORD instead of stapled to it, or a commercial operator building out Part 108 compliance before the final rule drops - we would love to show you what it looks like when it all works together. Reach out to us and we'd love to hook you up.
Stay Dangerous.