All-Domain Weather & Environmental Intelligence
How Empyrean transforms weather, fire, space weather, and environmental data from passive overlays into operationally actionable intelligence - degrading sensor models, predicting fire spread, enriching live tracks, and feeding RF propagation planning.
The Problem
Weather data is everywhere. Every platform can show you a temperature reading or overlay a radar loop. But showing weather is not the same as using weather. The gap between "it's raining" and "your Ku-band radar's probability of detection just dropped 40% against sub-RCS targets at bearing 270" is the gap between a weather widget and weather intelligence.
Most operational platforms treat environmental data as a passive layer - something the operator glances at and mentally factors into their decisions. That mental model breaks when you're managing dozens of tracks across multiple sensor types, each with different atmospheric sensitivities, while simultaneously planning UAS missions, monitoring wildfire proximity, and assessing whether space weather is degrading your SATCOM links.
Empyrean makes weather and environmental data a first-class participant in the decision loop. It doesn't just display conditions - it computes their operational effects, degrades sensor models accordingly, predicts cascading impacts, and surfaces the "so what" inline where operators are already working.
Modules Used
- Common Operational Picture - environmental overlays, fire perimeters, population density, and inline weather context on every track card
- Fusion & Decision Engine - weather-aware sensor degradation modeling, suspicious track flagging under adverse conditions, and fire spread prediction
- EMSO - RF propagation modeling with atmospheric attenuation (ITU-R P.676/P.838), precipitation scatter, and ducting effects
- Space Situational Awareness - space weather impact on orbital predictions, pass window reliability, and HF/GPS degradation indicators
- Policy & Decision Layer - weather-conditioned policy gates, fire proximity alerts, and environmental threshold triggers
The Integration Stack
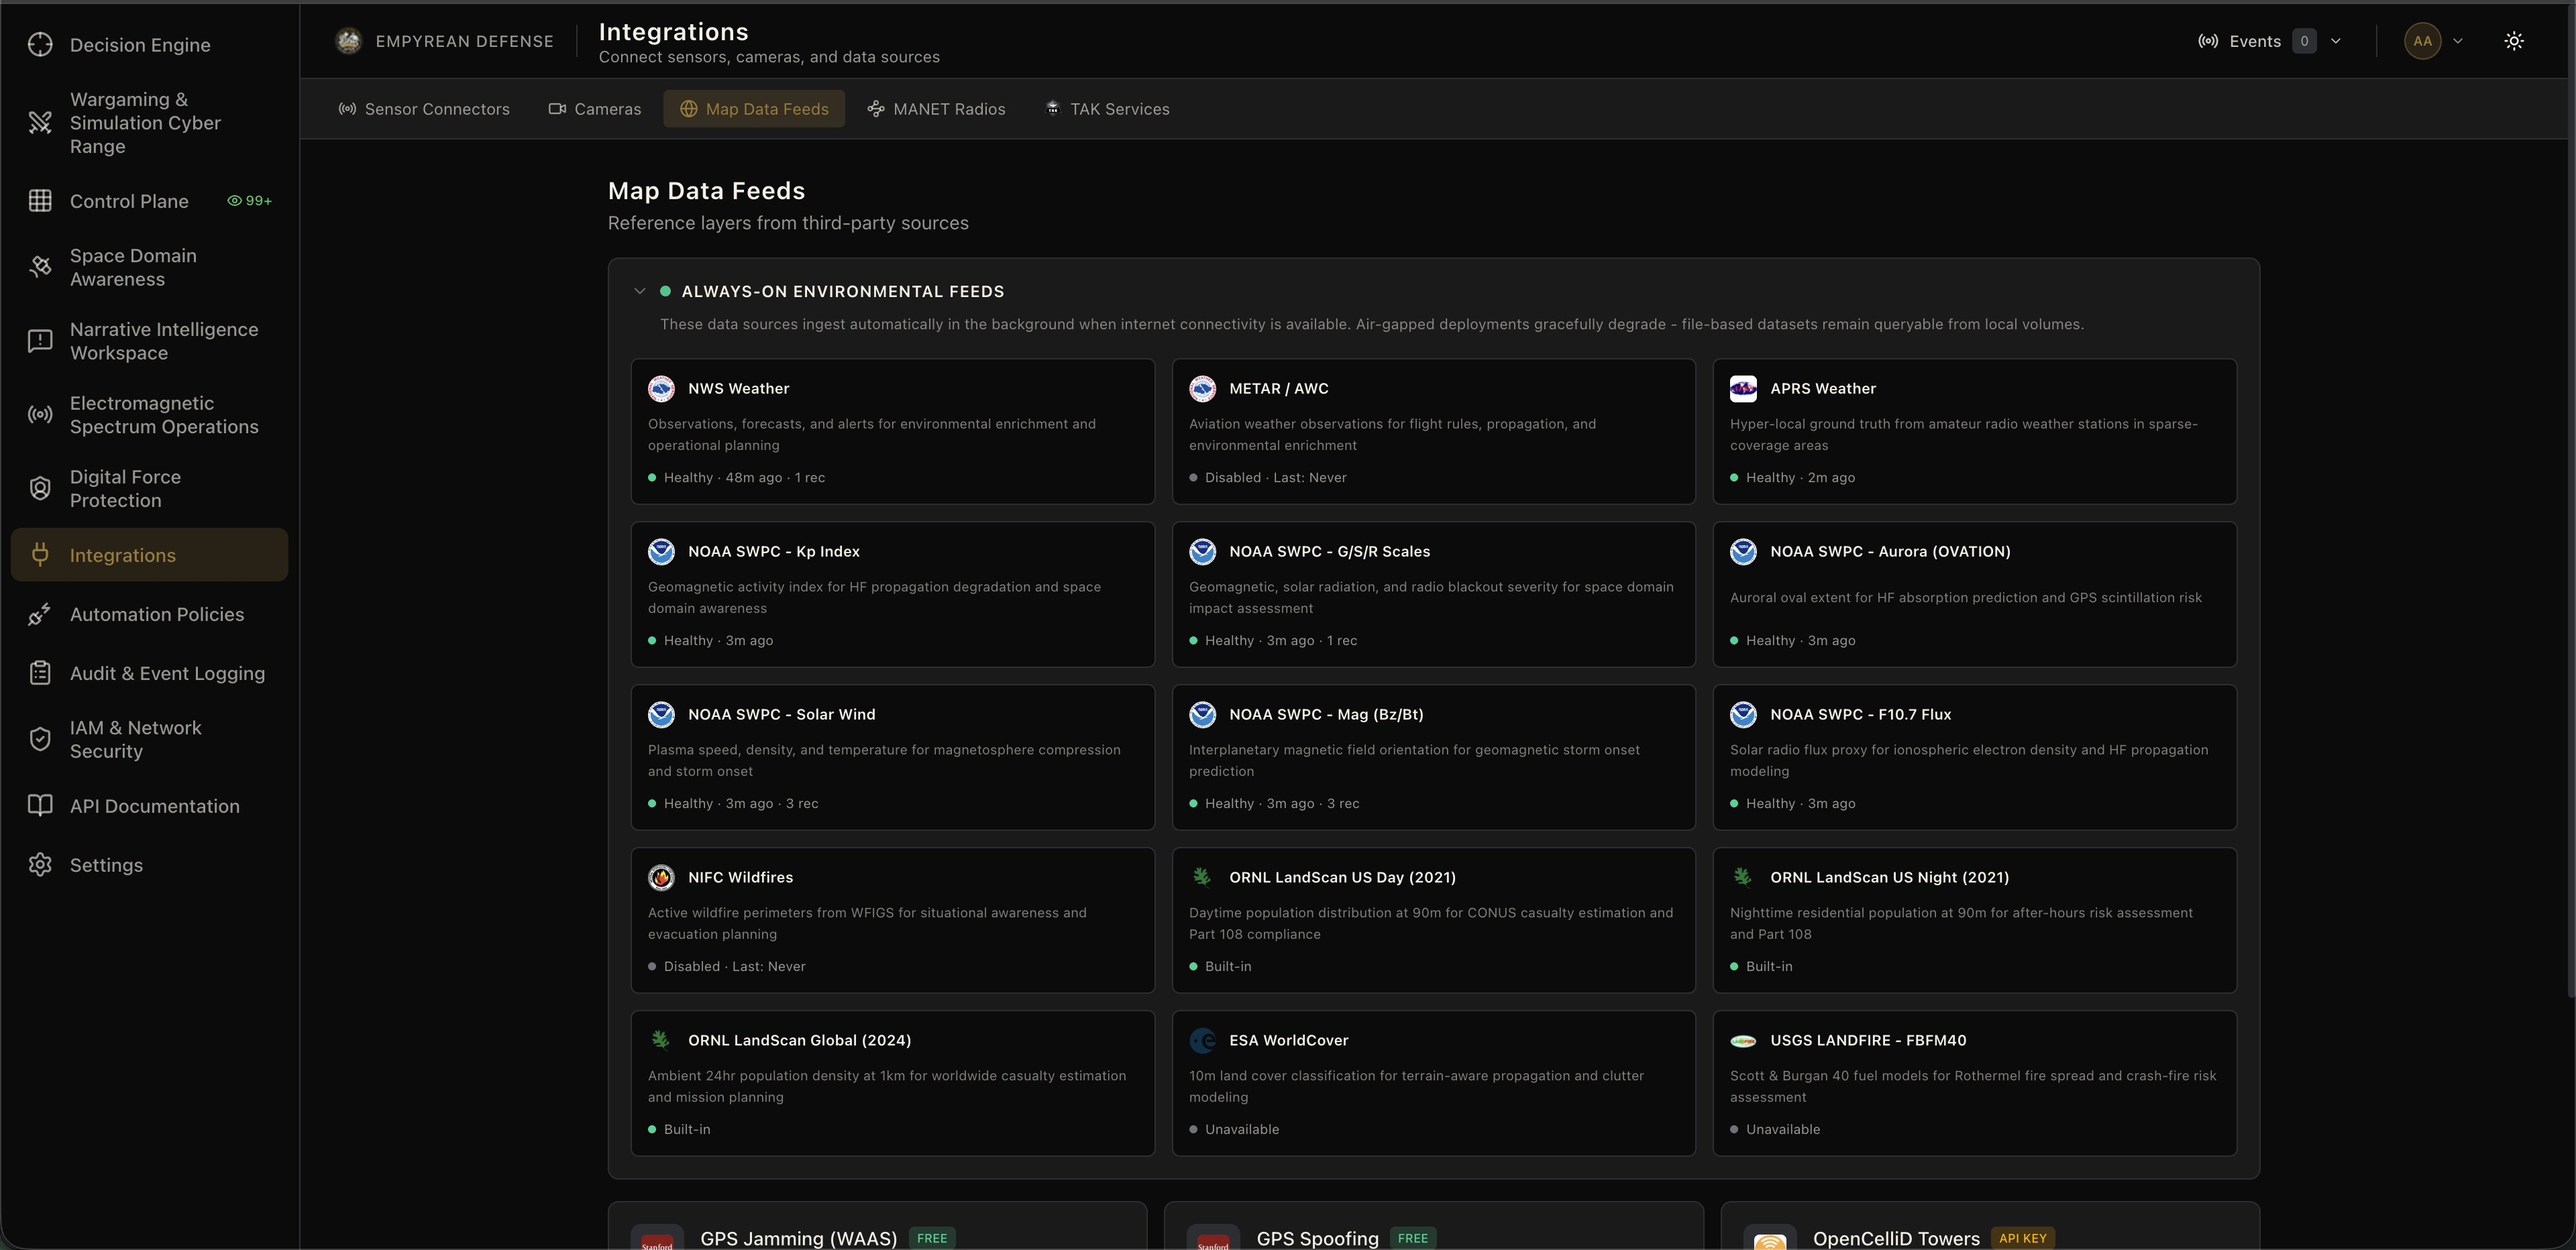
This recipe composes nine live integrations and two planned sources into a unified environmental intelligence layer:
Terrestrial Weather:
- NWS Weather API - primary US weather source (hourly auto-refresh per fusion zone)
- Aviation Weather Center METAR/TAF - airport-level observations for international coverage
- APRS Weather Stations - hyper-local ground truth from amateur radio operators (<10km proximity override)
- Kestrel 5700 Elite (Coming Soon) - operator-position measured conditions via BLE/USB
Fire & Vegetation:
- NASA FIRMS - near-real-time VIIRS satellite fire detections with fire radiative power
- NIFC Active Wildfire Perimeters - authoritative fire boundary polygons with containment status
- LANDFIRE Fuel Models - 80 fuel model rasters for physics-based fire behavior prediction
- ESA WorldCover - 10m land cover classification for terrain flammability and ground risk
Space Environment:
- NOAA SWPC - Kp index, G/S/R storm scales, solar wind, aurora probability, F10.7 flux
Population & Exposure:
- ORNL LandScan - 90m gridded population density (day/night) for civilian impact assessment
Planned:
- Tomorrow.io - global coverage + minute-level nowcasting for international operations
How It Works
Terrestrial Weather: More Than a Forecast
The Weather Intelligence Service maintains a priority chain: NWS is primary, METAR/TAF augments for aviation-specific conditions and international coverage, and APRS weather stations provide hyper-local ground truth when they're within 10km of your area of interest. When the Kestrel 5700 integration ships, measured conditions at the operator's physical position will outrank all three for immediate-area assessments - real atmospheric data from a calibrated instrument rather than interpolated forecasts. Every active fusion zone and opted-in map feature gets hourly auto-refresh with WebSocket broadcast so the COP stays current without operator intervention.
What makes this operationally different from a weather widget is where the data goes after ingest. Temperature, humidity, wind, visibility, precipitation type and intensity, pressure, and dewpoint feed directly into:
- RF propagation atmospheric modeling (ITU-R P.676 gaseous attenuation, P.838 rain attenuation) for realistic comms planning and EMSO sensor envelopes
- UAS flight envelope validation - wind speed vs. airframe limits, visibility minimums, icing conditions
- Sensor degradation coefficients - the fusion engine adjusts detection probability estimates based on current conditions, so a radar track shown at 3km in heavy rain gets appropriate confidence scoring
The result: when the fusion engine flags a suspicious low-altitude track with questionable kinematics during a thunderstorm, the operator sees why the confidence is lower and can make an informed decision rather than chasing weather-induced ghosts.
Fire Intelligence: From Detection to Predicted Spread
NASA FIRMS provides the detection - satellite-observed thermal anomalies with fire radiative power (FRP), brightness temperature, and confidence scoring. But a fire detection dot on a map doesn't tell you where the fire is going.
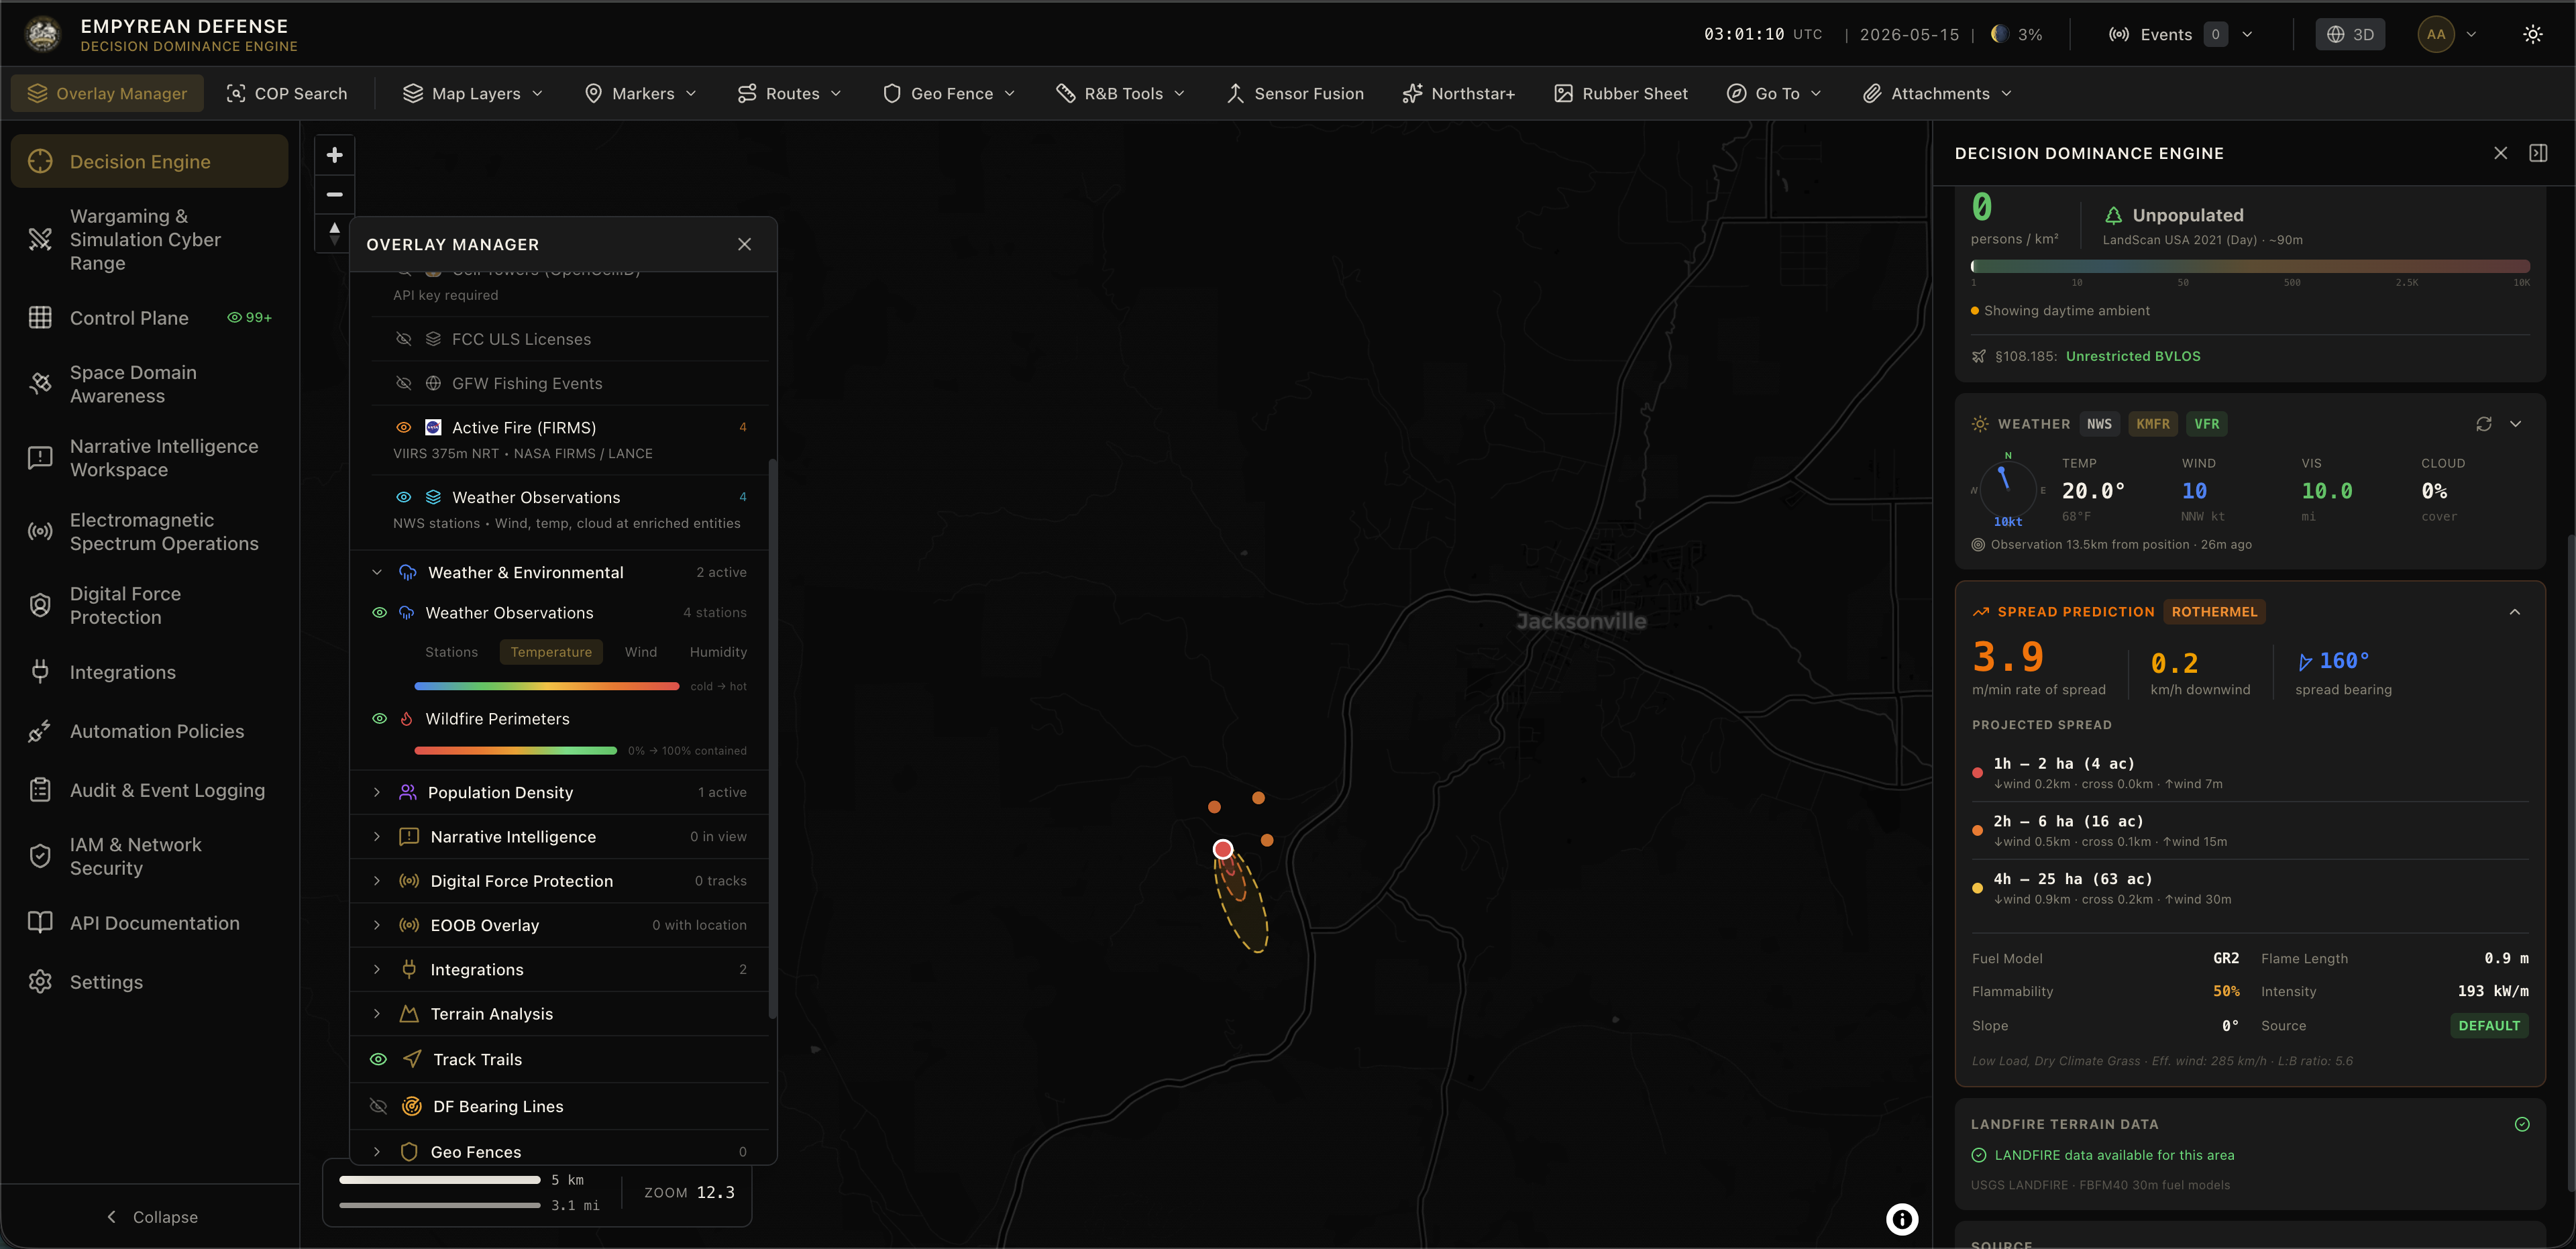
When FIRMS reports a high-FRP detection (>10 MW), the platform automatically triggers the Rothermel fire spread prediction engine. This pulls:
- LANDFIRE fuel models - what's burning (grass, timber, slash) and how fast it carries fire
- ESA WorldCover - land cover classification for terrain flammability context
- SRTM elevation - slope and aspect that accelerate or retard spread
- Live weather - wind speed/direction, humidity, and temperature from the Weather Intelligence Service
The output is a time-projected spread ellipse (1h, 2h, 4h) with rate of spread, fireline intensity, flame length, and spread direction. This gets rendered as GeoJSON on the COP and correlated against:
- NIFC wildfire perimeters - is this a known fire growing, or a new ignition?
- LandScan population density - how many people are in the projected path?
- Active geofences - does the predicted spread threaten any of your protected areas?
- UAS operations - are any of your assets operating near active fire or within TFRs?
For C-UAS operators near wildfires, this context is critical. Firefighting UAS, news drones, and curious operators all converge on active fires. Knowing the fire's predicted movement helps distinguish legitimate firefighting assets from threats operating under the cover of a chaotic airspace.
Live Track Enrichment: Weather Where You Need It
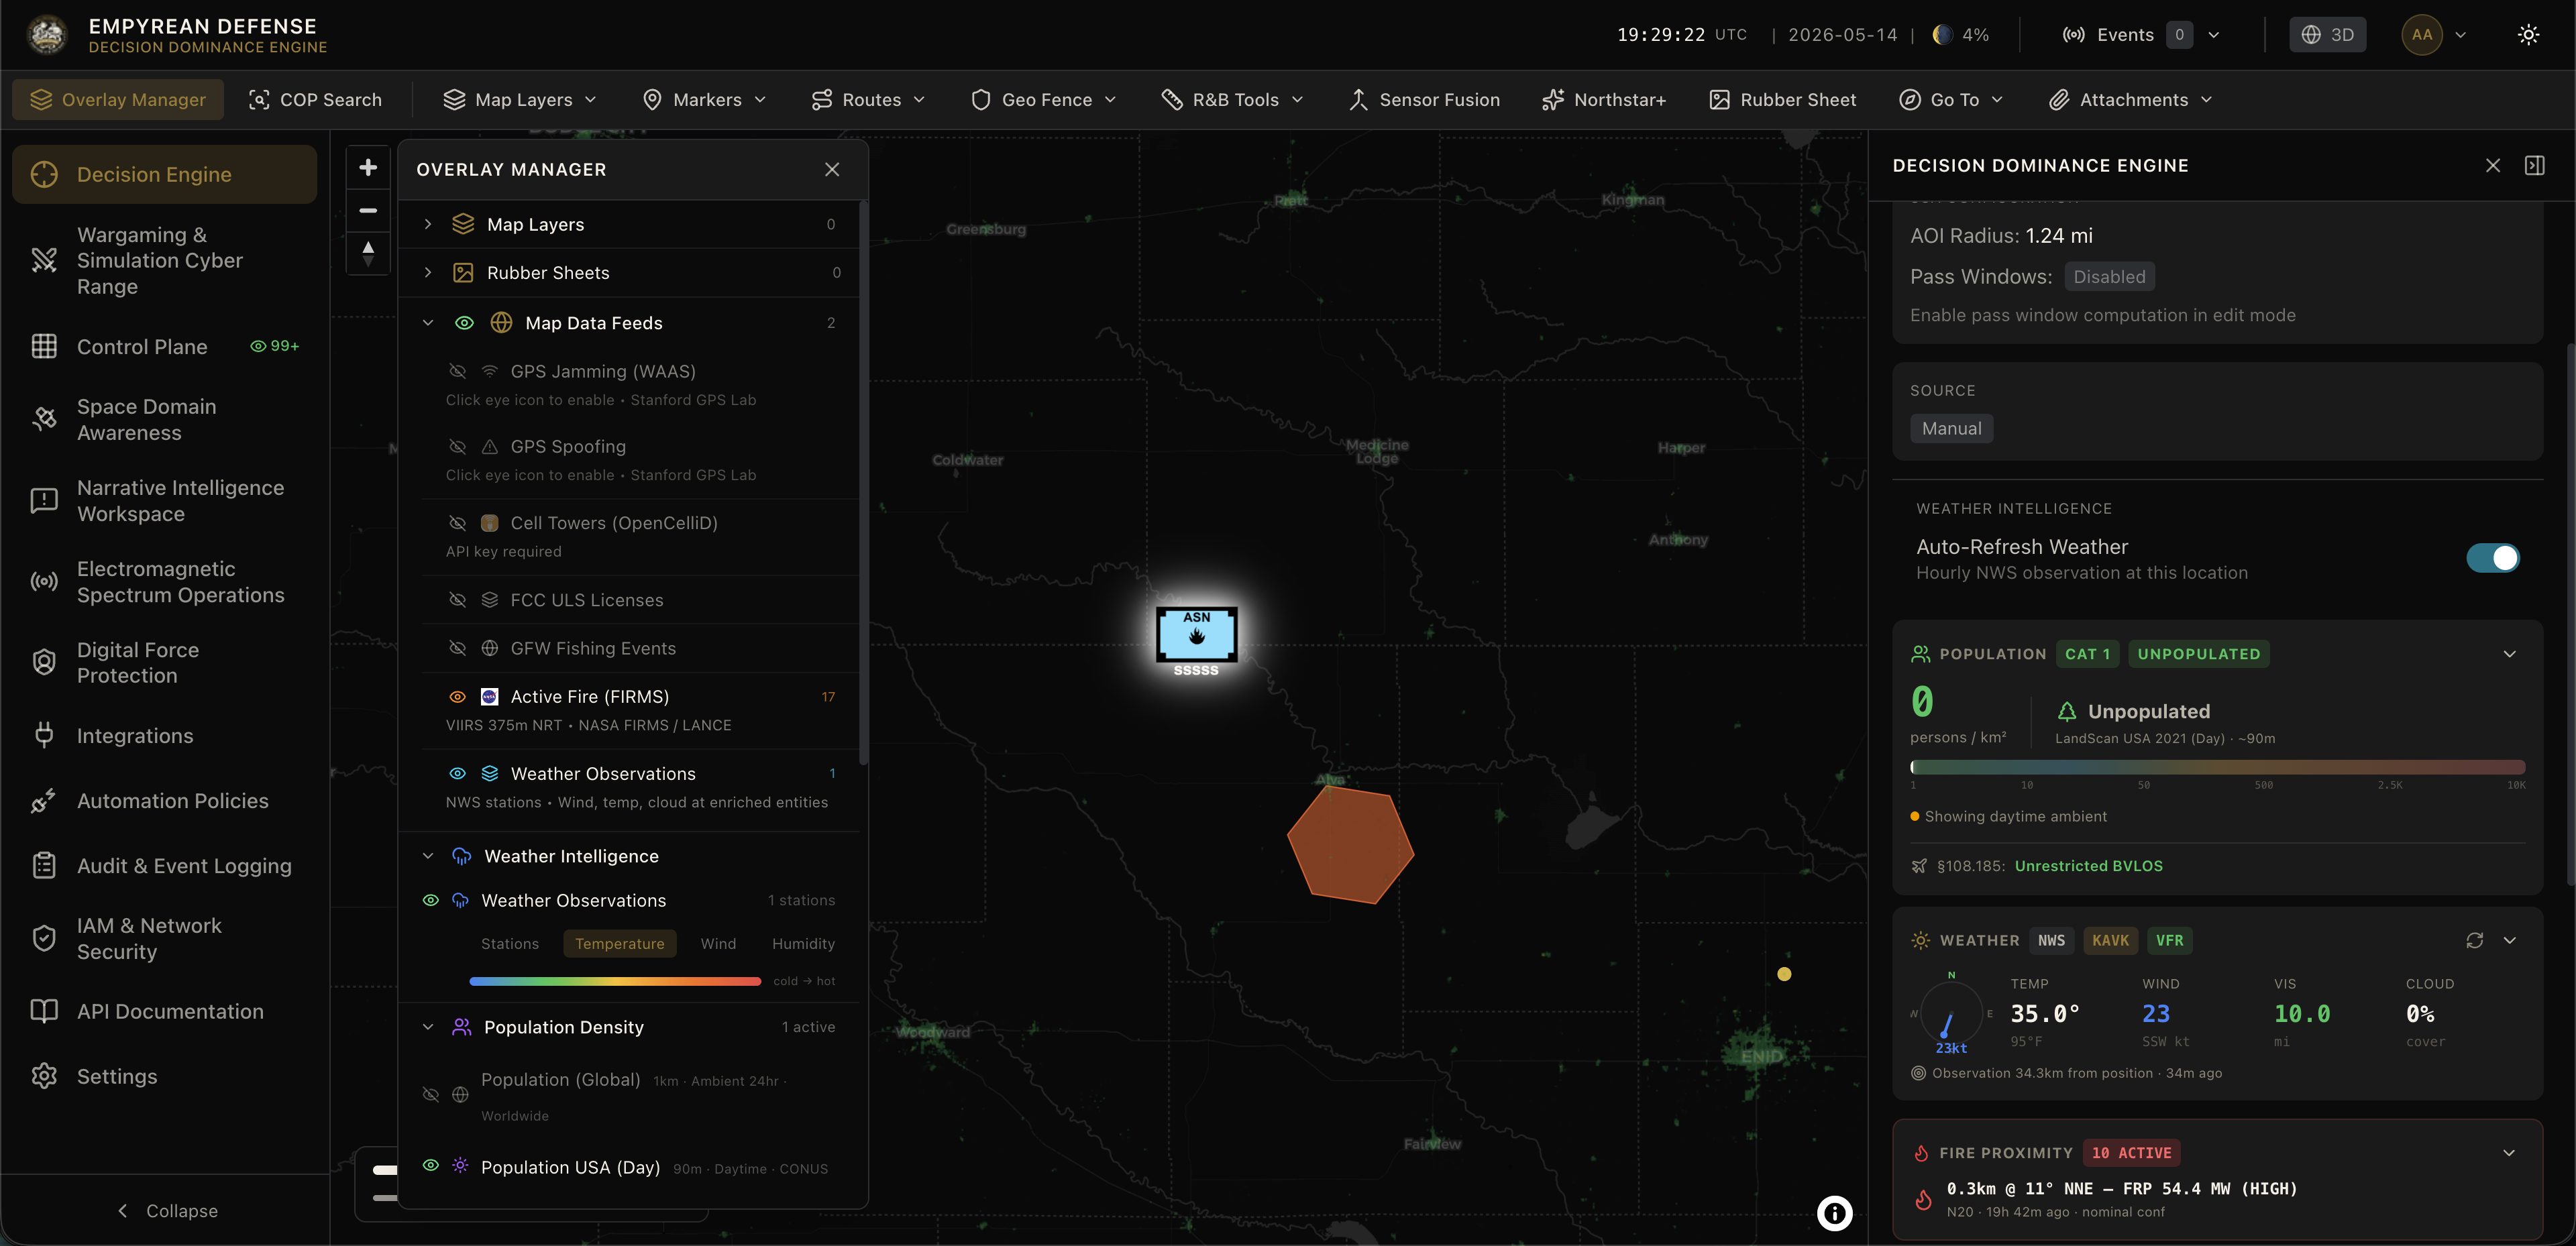
Every live track on the COP - air, maritime, ground, space - gets inline environmental context on its track card. In addition to identity, metadata, kinematics, and track-specific data, the right panel shows:
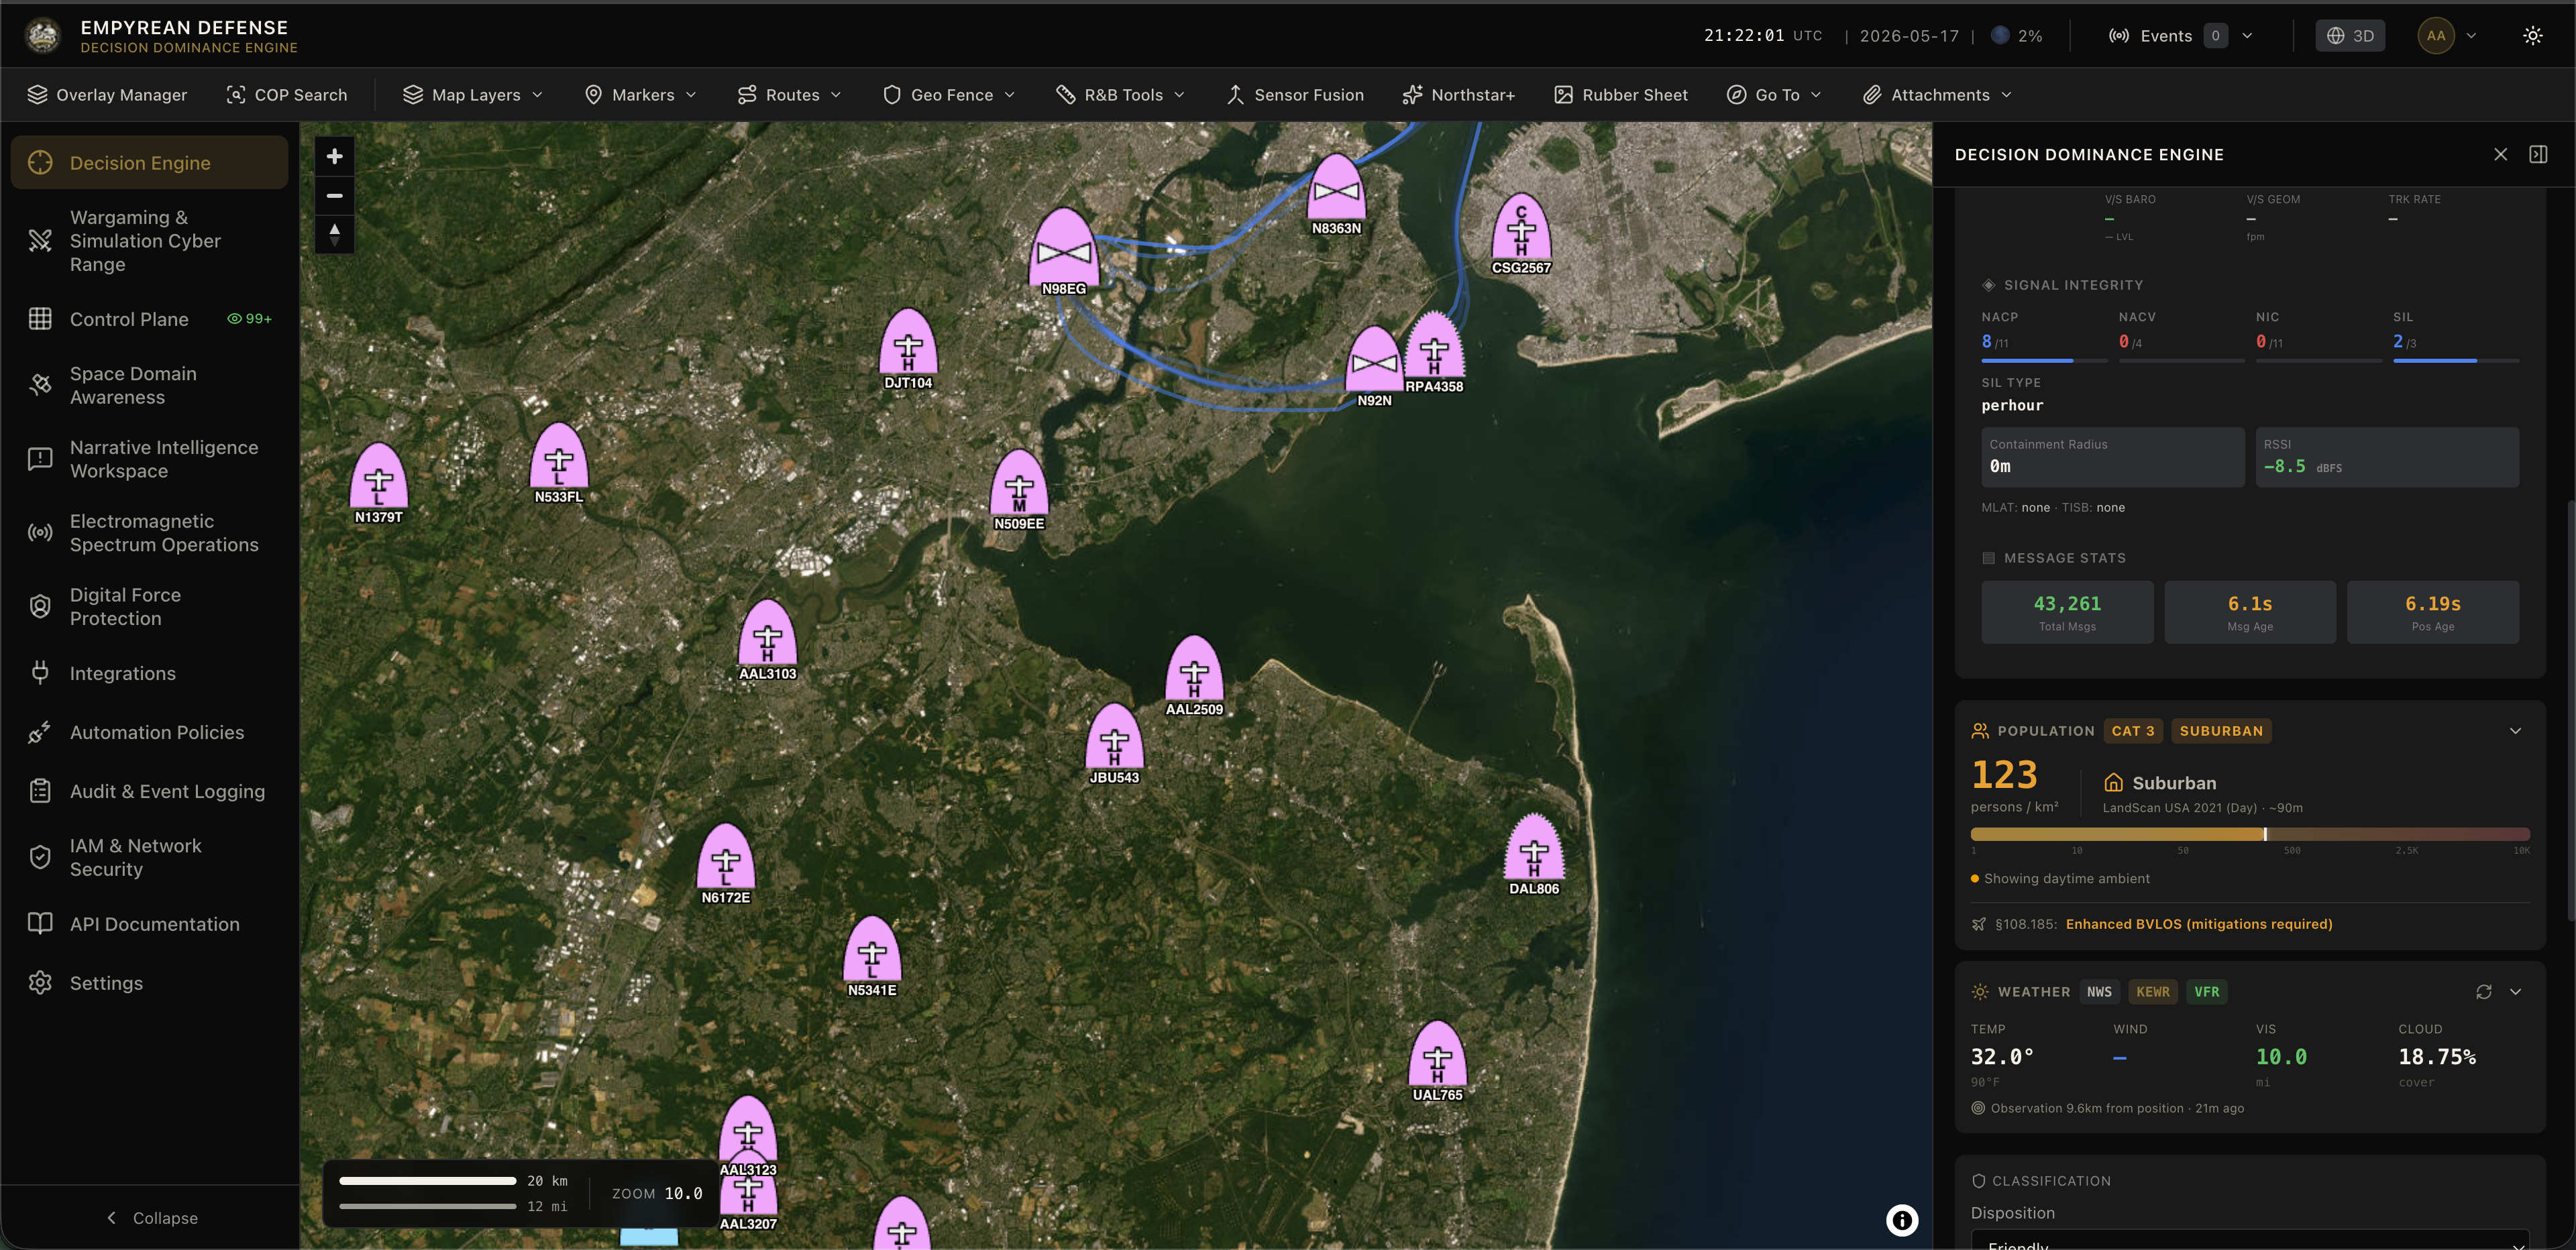
- Current weather conditions at the track's position
- Population density at the track's location (day/night aware)
- Fire proximity if active fires are nearby
- Smoke and visibility impacts from nearby wildfires
This isn't a separate weather tab the operator has to navigate to. It's inline, contextual, and automatic. When a track is loitering at low altitude in degraded visibility near an active fire, the operator sees all of that context in one glance rather than mentally cross-referencing three different overlays. This is what a real Common Operating Picture should do - compress decision time by putting the right context next to the right track at the right moment.
Space Weather: Orbital Operations in Context
NOAA SWPC data feeds directly into the Space Situational Awareness module. The platform ingests seven products on a 5-minute cycle:
- Kp index drives Policy Engine conditions (
space_weather_kp >= 5triggers alerts) - G/S/R storm scales provide at-a-glance severity for geomagnetic storms, solar radiation, and radio blackouts
- Solar wind plasma and magnetic field (Bz component) indicate real-time magnetospheric compression
- F10.7 solar flux feeds LEO atmospheric drag modeling for more accurate orbital predictions
- OVATION aurora probability renders as a heatmap overlay on the 2D COP and 3D globe
Operationally, this means pass window predictions account for atmospheric drag variations during geomagnetic storms. HF propagation degradation indicators tell the EMSO operator when their HF SIGINT sensors are likely to underperform. GPS accuracy degradation warnings correlate with the Stanford WAAS interference data already on the COP. The space weather picture isn't decorative - it directly modifies the confidence and reliability assessments of space-dependent systems.
Health Monitoring and Caching
All weather and environmental feeds are health-monitored with configurable staleness thresholds. The platform caches data in the background for all your points of interest, so you can pull on-demand or rely on the most recent observation without waiting for a fresh API call.
APRS weather stations use a 30-minute staleness threshold. NWS refreshes hourly. FIRMS polls every 30 minutes. NOAA SWPC updates every 5 minutes. If a source goes stale or unreachable, the platform degrades gracefully - using cached data with a staleness indicator rather than showing nothing.
RF Propagation: Weather-Aware Comms Planning
Your Ku-band C-UAS radar covers 5km in clear conditions. Moderate rain rolls in and that envelope shrinks to 3.2km - a 36% reduction in detection range that nobody announced over the radio. The EMSO workspace shows you that difference in real time because the RF propagation engine doesn't model radio waves in a vacuum. It ingests live atmospheric conditions and computes realistic attenuation using ITU-R recommendations:
- P.676 - gaseous attenuation from oxygen and water vapor absorption (critical above 10 GHz)
- P.838 - specific rain attenuation based on precipitation rate and frequency
- Ducting and refractivity - temperature inversions and humidity gradients that create anomalous propagation
When you're planning jammer placement, assessing radar coverage, or validating MANET connectivity, the propagation envelopes reflect today's weather, not a clear-sky assumption. The sensor coverage you briefed this morning may not be the sensor coverage you have right now - and the platform keeps that picture honest.
UAS Mission Planning and Part 108 Compliance
The environmental intelligence stack feeds directly into UAS operational planning. Combined with LandScan population density (which FAA Part 108 mandates for population category classification) and the forthcoming UAS Planning Module, operators can:
- Validate flight envelopes against current and forecast wind, visibility, and precipitation
- Classify population density categories along planned routes using day/night LandScan grids
- Assess ground risk using ESA WorldCover land cover classification
- Check fire proximity and TFR conflicts against active FIRMS detections and NIFC perimeters
- Factor weather-degraded sensor performance into mission risk profiles
This goes beyond what Part 108 mandates. The regulation requires population density assessment - Empyrean provides that plus weather risk, fire risk, sensor degradation modeling, and real-time environmental awareness throughout the mission, not just at planning time.
Why This Matters
The difference between weather data and weather intelligence is whether the machine does the "so what" for you. Showing a temperature on a dashboard is data. Automatically adjusting your radar's detection probability model because humidity just spiked and computing that your Ku-band coverage shrank 1.8km on the eastern sector - that's intelligence.
Empyrean's environmental intelligence layer doesn't ask operators to be meteorologists, fire behavior analysts, and space weather forecasters on top of everything else they're doing. It ingests the data, computes the operational effects, and surfaces the results where they matter: on the track card, in the sensor model, on the propagation envelope, and in the policy engine's decision logic.
Pair it with pre-provisioned WMS and TMS feeds for traditional weather radar overlays, and you get both the human-readable picture and the machine-readable intelligence in one operational environment.
Deep Dive
For the full integration details on each environmental data source - connection methods, data formats, and refresh cadences - see the Integrations page.
For how sensor fusion handles degraded-confidence tracks under adverse conditions, see the Fusion & Decision Engine capability page.
For RF propagation modeling and atmospheric effects on the electromagnetic environment, see the EMSO capability page.
For space weather's impact on orbital operations and the broader space domain, read How the Space Domain Impacts Your Operations.
